See exactly what you'll use
Real screens from Video from Spreadsheet inside vidBoard, from the first click to the finished file.
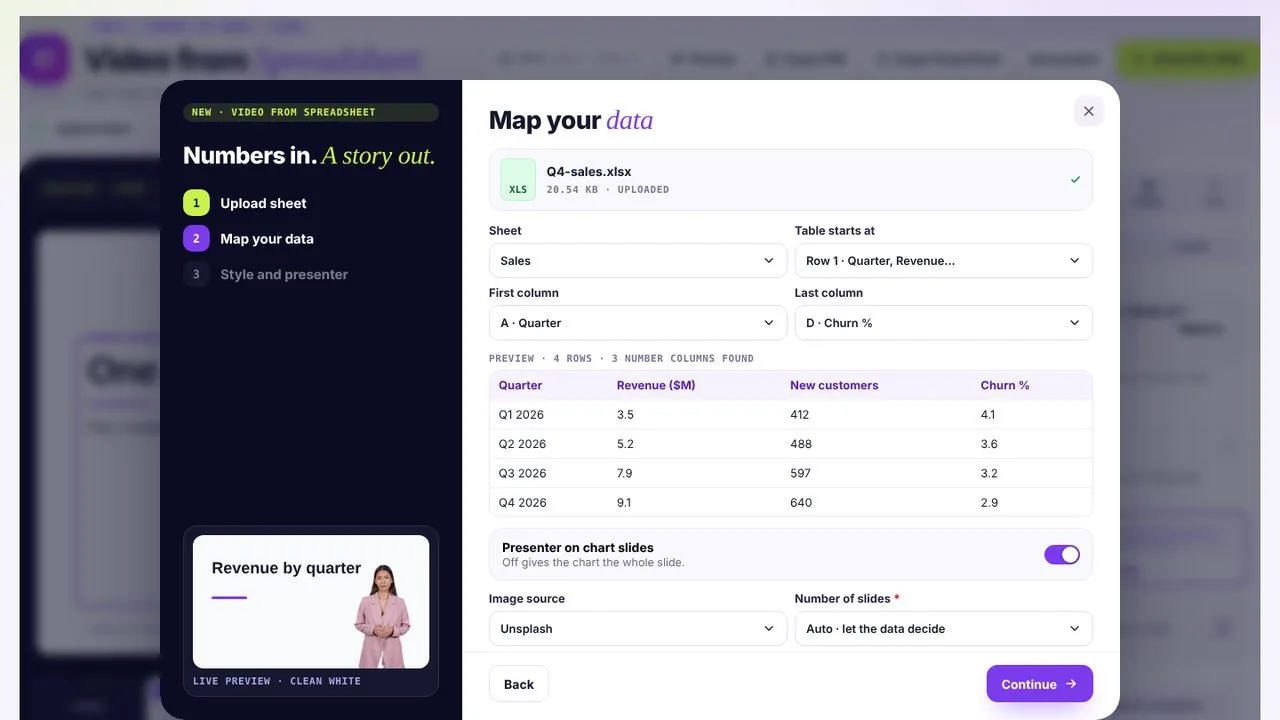 01Map your data
Choose the sheet, columns and rows, and preview what was found.
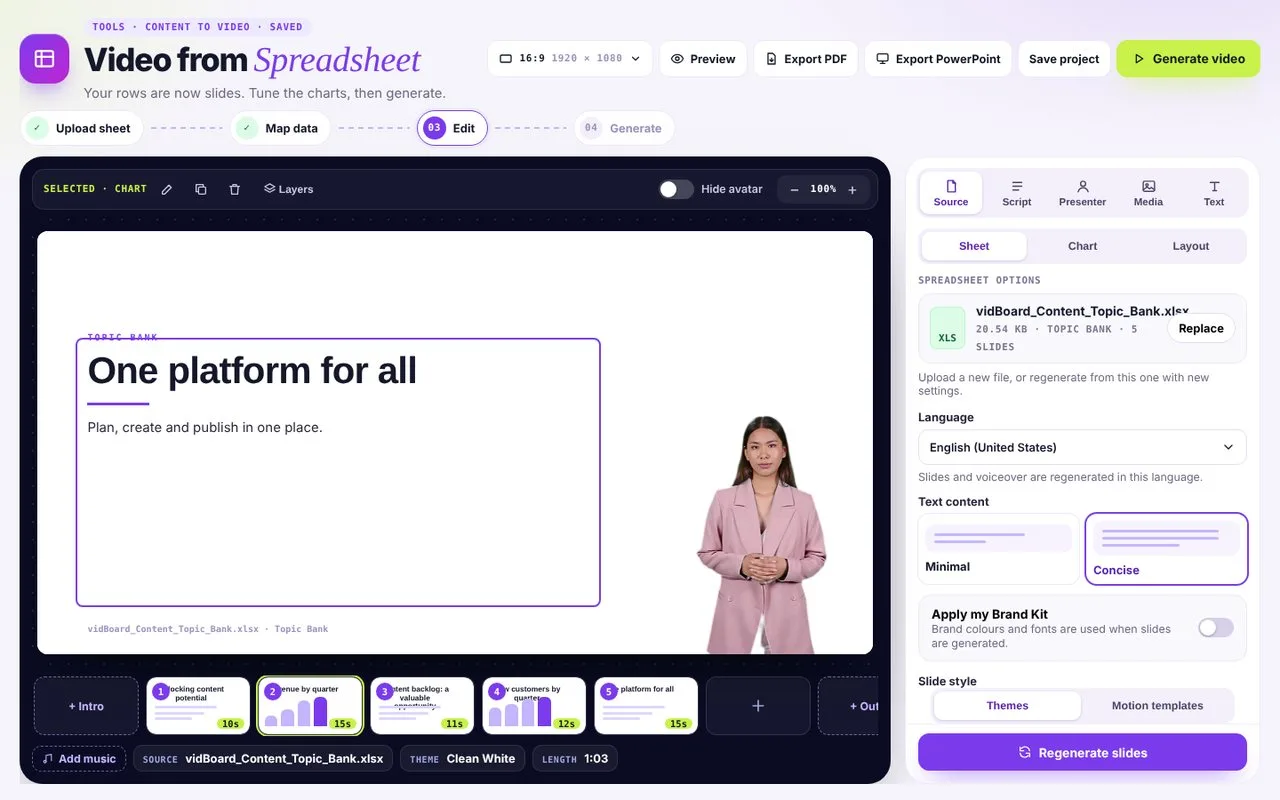 02Get the first cut
Rows become slides and number columns become charts.
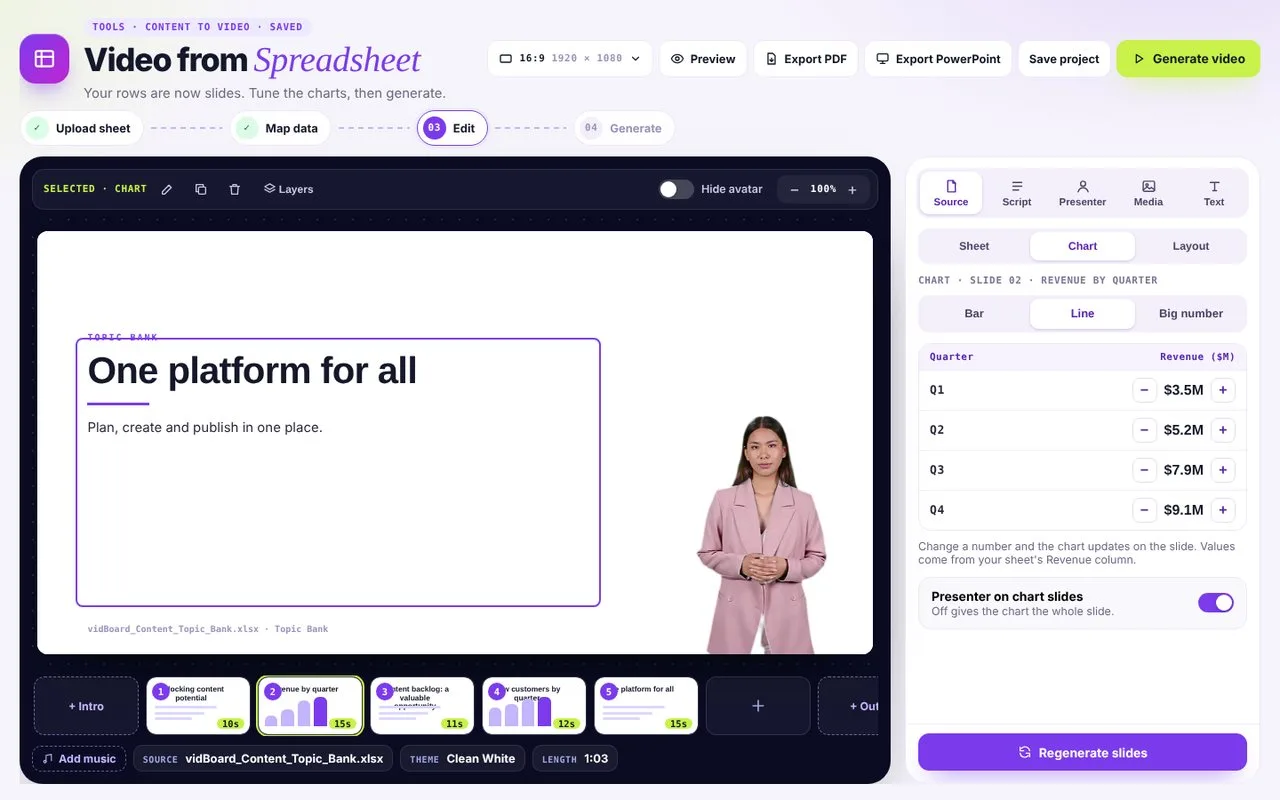 03Tune the charts
Switch between bar, line or big number and edit values right on the slide.
Built for data people, loved by everyone else
- 01
Charts that animate
Bars grow, lines draw and numbers count up as the narrator speaks.
- 02
A script from your numbers
vidBoard writes narration that explains what changed and why it matters.
- 03
Your brand on every chart
Colours and fonts from your Brand Kit, applied automatically.
Spreadsheet questions
Which files can I upload?
Excel (.xlsx) and CSV files, one sheet per file, up to 50 MB. The first row should name the columns.
How does vidBoard pick the chart?
Each data template is built for one kind of story, such as a KPI dashboard, a trend or a ranking. Pick the one that fits your numbers.
Can I check the numbers before rendering?
Yes. Pick the sheet, columns and rows and preview them first. In the editor you can change any chart value and switch between bar, line or big number.
Can I make vertical videos for social?
Yes. Vertical data templates turn the same sheet into a 9:16 video.