Give every research report a narrated visual summary
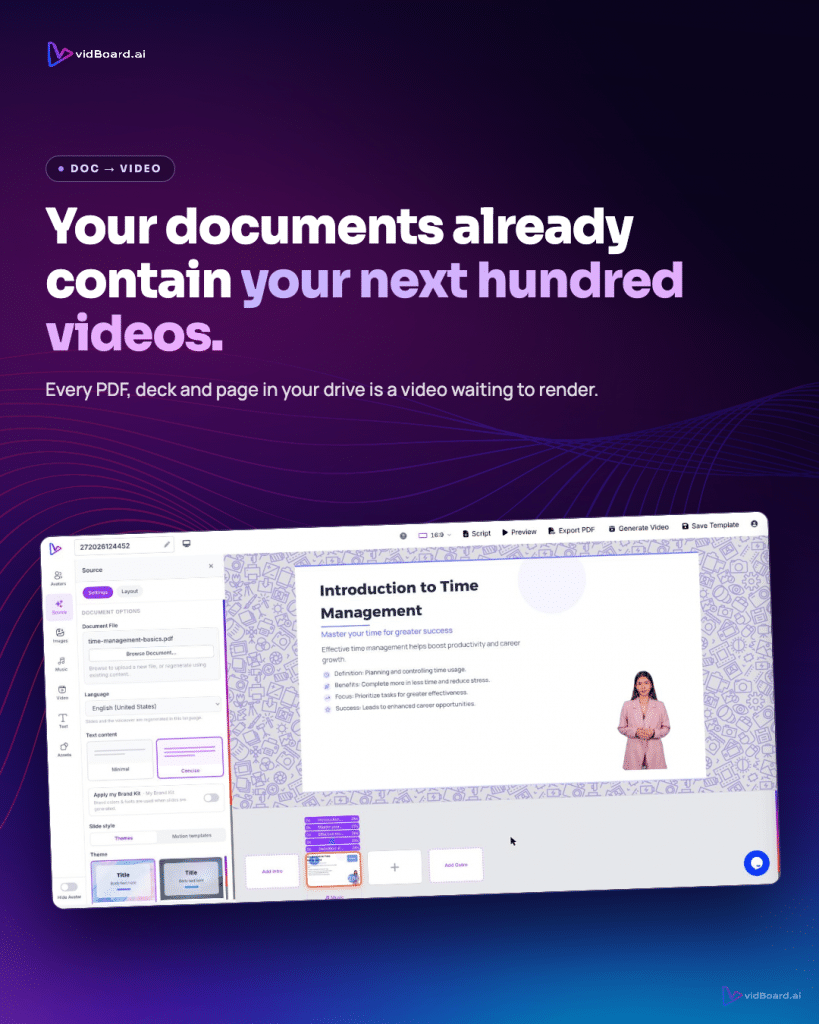
You have a research report — a PDF, a PowerPoint or a published article — that contains findings, charts and recommendations. Turning that same source file into a short, narrated visual summary makes the work shareable across formats, preserves the original facts and keeps every element editable so the team retains control.
Why a narrated visual summary fits research teams
Research-led organisations sit on structured source material: reports, slide decks, appendices and web-published pieces. vidBoard’s core idea is to start from that existing content, not a blank timeline. That matters for research teams for three practical reasons.
- Faithful reuse of the original work. Document → Video and PowerPoint → Video read your files and use the report’s real facts, names and numbers rather than inventing new ones. The AI builds a narrated draft from the material you already prepared, preserving the integrity of findings while converting them into a visual narrative.
- Speed without losing editability. The generated video is an editable canvas: text, images, layout, timing, motion and voice remain changeable. If a chart or a conclusion needs refinement after review, you edit that slide or regenerate a single slide instead of rebuilding the whole video.
- One source, many formats. A single project exports to landscape, portrait and square orientations with layouts adapted per orientation. That means the same report can produce a long-form YouTube explainer, a vertical summary for social, and a square clip for syndication — all from the same master and without manual recuts.
How to convert a report into a compact, on-brand video
Make the conversion concrete with a repeatable workflow that research teams can slot into production pipelines.
- Choose the right input. Upload the report (PDF/Word), import the PowerPoint, or paste the article URL. vidBoard will parse the source into scenes and draft narration so you start from the report’s actual content.
- Apply the Brand Kit and a template. Store colours, fonts and logos once in Brand Kit and apply them automatically to every generated project. Select from the ~129 AI-fillable designs — motion templates and presentation layouts — so the summary looks like your organisation’s work, not a generic video.
- Review and tighten the script. The AI writes the first draft of narration from the document. Edit the text on the canvas, change timing on the timeline, or regenerate a single slide if the summary needs a different emphasis.
- Pick a voice and delivery. Use an AI voice from the multi-language library, clone a subject-matter expert’s voice for consistent narration across a course of reports, upload a human read, or choose an AI avatar where a presenter helps with credibility. The platform also supports silent visual summaries when narration isn’t required.
- Localise and caption. Add AI Subtitles (roughly 99 languages) with editable transcripts and caption translation. If you need dubbed versions for other markets, AI dubbing re-voices a finished video into another language without reshooting.
- Export and publish. Export an MP4, publish directly to YouTube from the finished-video screen, or export project slides as PDF for internal circulation.
Stretch value: governance, localisation and repurposing
One strength of turning reports into videos is that the process becomes part of an institutional production rule, not an ad-hoc task.
- Brand and editorial governance. Brand Kit enforces colours, fonts and logos across generated projects so every report summary adheres to your visual standards. Templates reduce design choices and make review cycles faster.
- Accessible and global distribution. Built-in subtitles, transcript editing and caption translation make summaries accessible to non-native speakers and to audiences who prefer text. AI dubbing multiplies region-specific versions without a re-shoot.
- Repurpose without reshooting. Per-slide regeneration, editable elements and a central projects dashboard let teams update a finding or correct a figure and re-export without rebuilding. The same source can feed a full-length explainer, a short social clip and a PDF summary for stakeholders.
- Media and fact integrity. Stock media and a media library make it simple to add visuals while the design rules enforce that charts appear only when real data exists, keeping visuals honest and evidence-led.
For research teams, the practical result is clear: your existing reports become the raw material for consistent, on-brand visual summaries that are easier to distribute, easier to localise and easier to update than filmed alternatives. The video is a controlled production step — not a one-shot generator output — so every slide, every caption and every voice remains editable until the research team signs off.